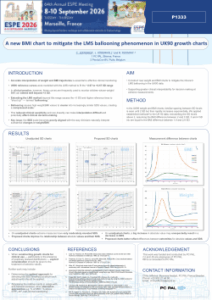
The urgent need for charting tools to aid the monitoring and management of severe obesity in childhood and adolescence was discussed at PC PAL’s booth during the recent annual congress of ESPE (Marseille, 8 – 10 September). PC PAL presented an approach to the problem in its congress poster.
Charts such as UK90, based on the LMS method, were designed for BMI values within the -2.67 to +2.67 SD range. These charts are difficult to interpret in the case of children and adolescents with severe obesity: the higher reference lines can increase exponentially, a phenomenon known as LMS ballooning. This can result in very high weight or BMI measurements being compressed into a relatively narrow range of SDS values. Consequently, the SDS may become less sensitive to clinically meaningful changes and less intuitive to interpret.
PC PAL explored an alternative approach to modelling the upper end of the UK90 weight and BMI distributions. The proposed method remodels the SDS levels above +2 SD so that the BMI difference between successive higher SDS levels remains consistent with the difference between +1 and +2 SD. The approach was applied to UK90 data and illustrated using revised weight and BMI charts for boys and girls.
The pragmatic aim is to provide a more clinically interpretable scale for very high weight and BMI measurements, potentially allowing changes in a child’s trajectory to be represented more meaningfully than when conventional LMS-derived SDS values are used at the extreme end of the distribution. Further work is needed to identify the optimal SDS threshold to apply the adjustment.
For the full poster please see: A new BMI chart to mitigate the LMS ballooning phenomenon in UK90 growth charts.